System Dependency Map
See how your Jira work connects — and edit dates and links right from a bar's card. A tiered dependency map of your issues, plus an editable Plan / Gantt lens on the same data. Pick what to show with simple filters or JQL, then read the picture the way that helps: graph, Gantt, or a chart.
Highlights
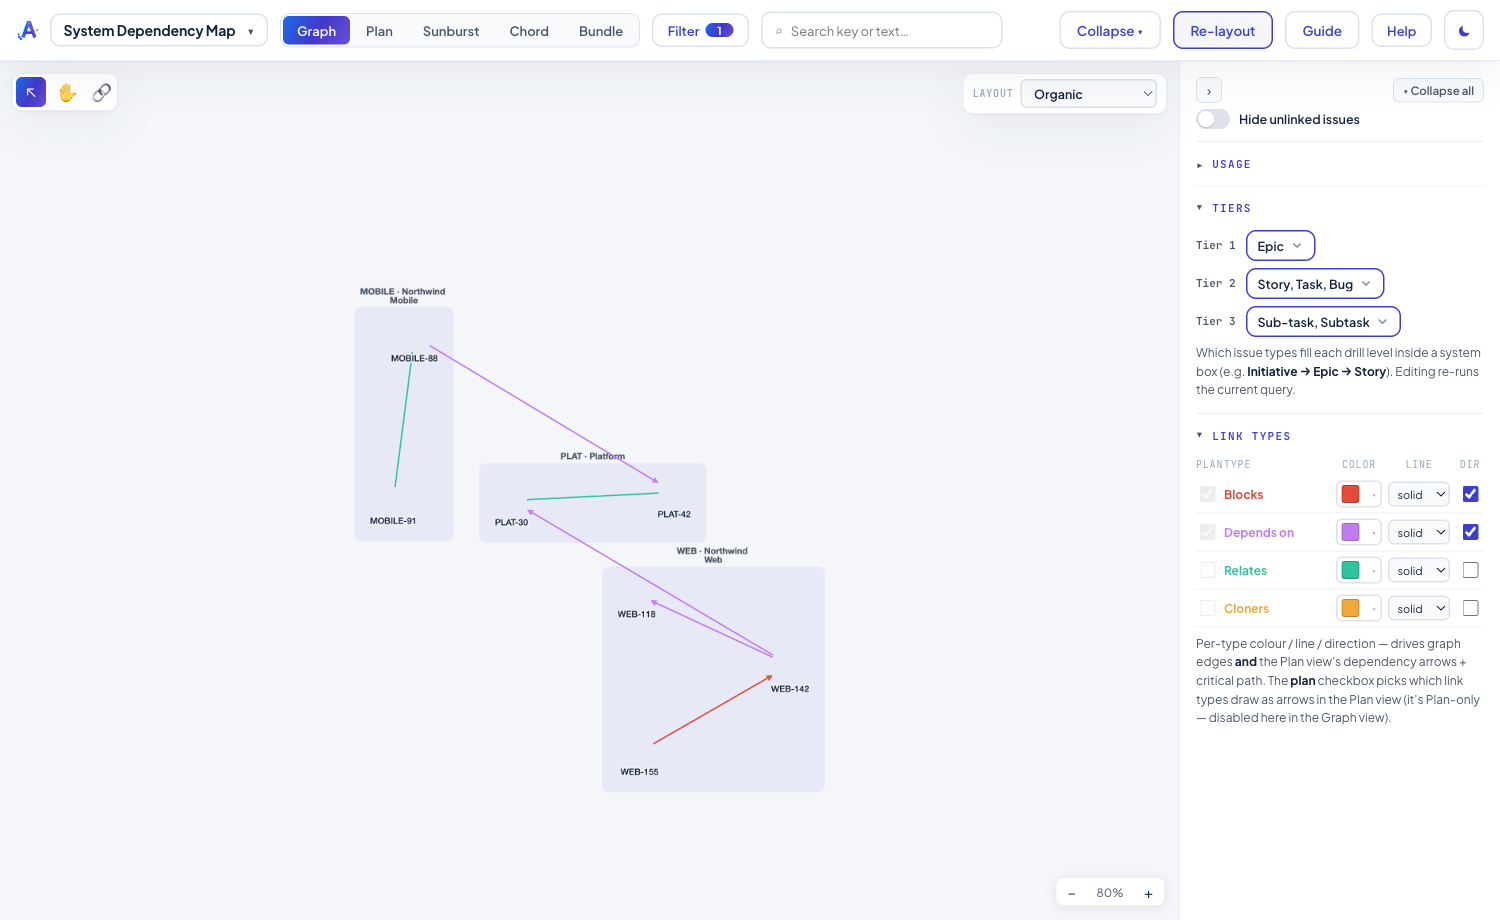
- A tiered graph you configure — up to three tiers (e.g. System → Epic → Story). Expand to drill in, collapse to step back out; you define what each tier's issue types are.
- Read-write links — drag from one issue to another with the 🔗 tool to create a link, or right-click a link to delete it. Both write to Jira as you, respecting your permissions.
- Filter three ways — Basic pickers, Advanced fields, or write JQL directly (checked and coloured as you type). Save any filter as a named query.
- Group into bands — by assignee, release, component, or parent, to see who owns what at a glance.
An editable Gantt on the same data
The same issues and links as a dependency Gantt. Bars are read-only — double-click one to edit its dates and links from its card (a field Jira won't let you set, like an epic's rolled-up dates, shows as read-only so changes always save cleanly). Colour a parent and its children as one family, get a warning when a child slips outside its parent's dates, and see the critical path that sets your end date.
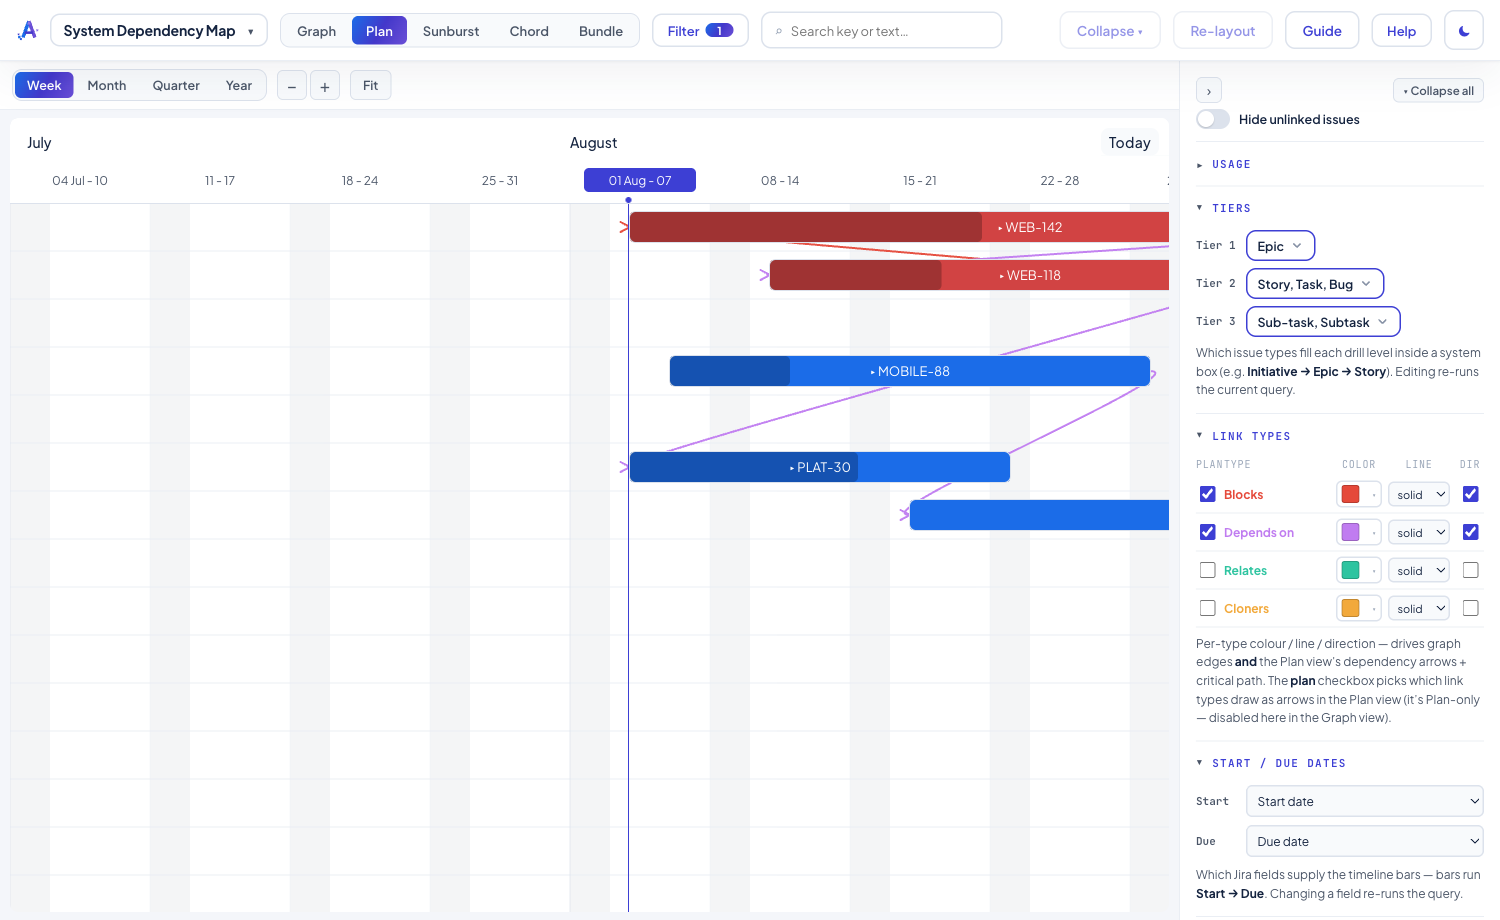
Beyond the graph and Gantt, three chart lenses — Sunburst, Chord and Bundle — show the same issues and links a different way, all respecting your current filters.
Read the full how-to in the Knowledge Base → System Dependency Map guide
Related: Program Status · Capacity Planning